Smaller import volume
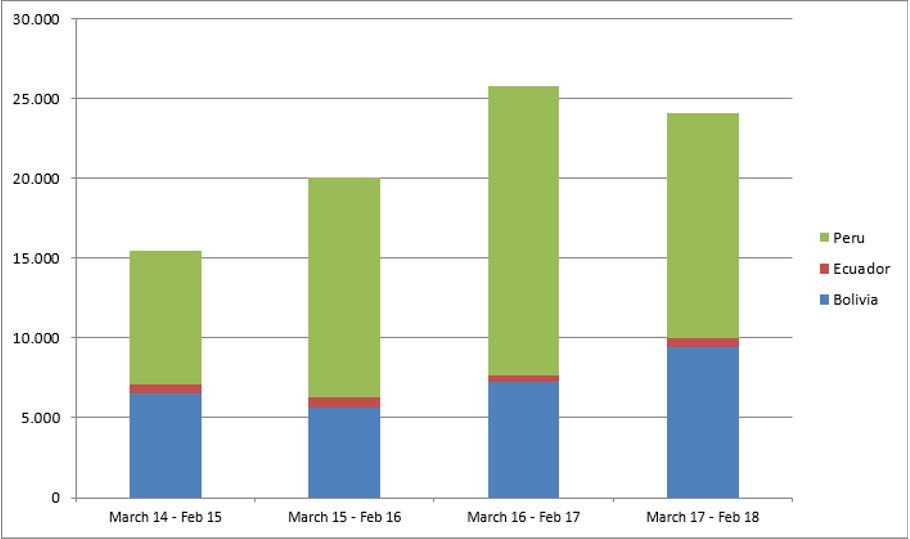
For the first since the quinoa boom began in 2013, there is a small decrease of 6.5% in European quinoa imports instead of growth (Figure 1). Bolivian exports have grown a lot and exports from Ecuador a little, but Peruvian exports are much lower, in the year ending February 2018. The increase in exports from Bolivia and Ecuador can’t make up for the decrease in exports from Peru. Total imports decreased from 25782 to 24097 tons.
Figure 1: Quinoa imports in tons per year, 2014/15–2017/18, year ending February
Monthly imports
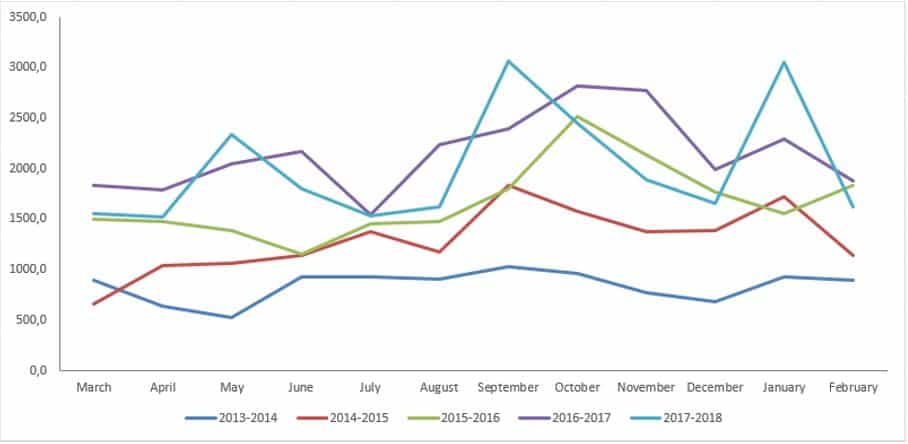
Quinoa imports fluctuated substantially in the past year (Figure 2). Monthly imports peaked in September 2017 and January 2018 with higher numbers than the years before. The general pattern is like previous years, with a first peak in September or October, a few months after the new crop has come in, and another one in January.
Figure 2: Monthly quinoa imports to Europe in tons, 2013/14–2017/18, year ending February
Import price continues to drop
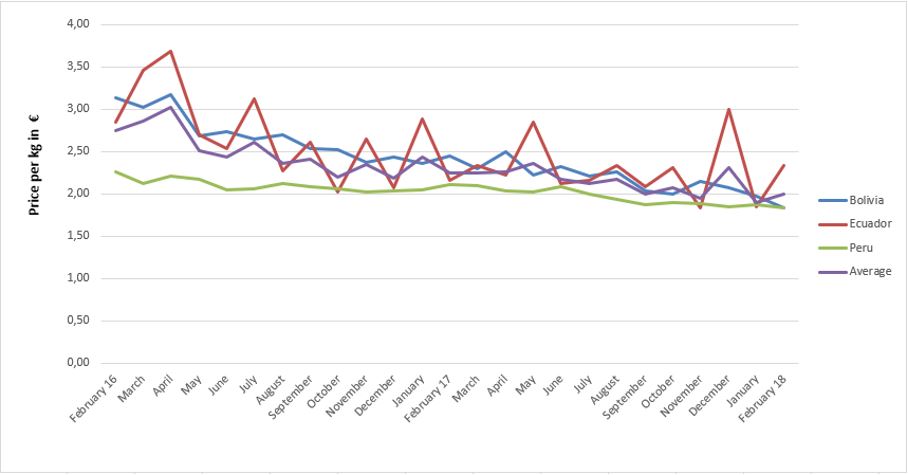
The average quinoa import price continues to drop (Figure 3). The downward trend is apparent for at least 24 months in a row now. Whereas in February 2016 a kg of quinoa earned €2.74 (US$3.21)1, two years later this price has dropped to €2.00 (US$2.34)1. Bolivian quinoa has generally been more expensive than Peruvian, but this difference is eroding fast. In February 2018 this price difference was only €0.01 (US$0.01)1. The price of Ecuadorian quinoa is fluctuating more than the others, just like it was in 2016. This may simply be a statistical effect of the much smaller trade volume.
Figure 3: Monthly quinoa prices in € per kg, February 2016–February 2018
Main origins
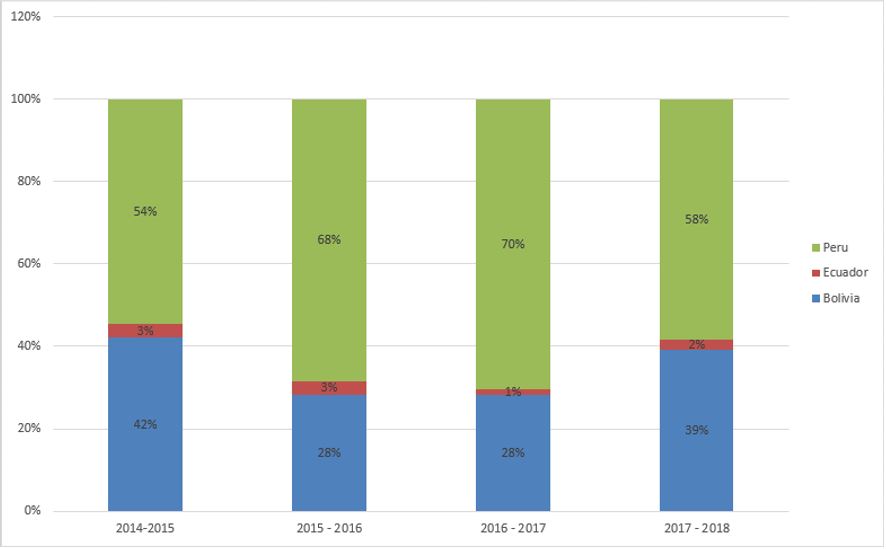
From 2015 onward, Peruvian quinoa exports to the European Union exceeded Bolivian exports. This is still the case, but the difference between the two major exporting countries got smaller in the 12 months from March 2017 – February 2018. In this period, Peruvian quinoa makes up for 58% of the European annual imports and Bolivian quinoa 39% Clearly, Bolivia is catching up with Peru. The quinoa import originating from Ecuador remains at 2%.
Peru, Bolivia and Ecuador still hold 98% of the quinoa import share in Europe. However, various other countries are trying to get a share in the European quinoa market: Colombia, Chile, the USA and Canada together exported 222 tons of quinoa to the European Union, in the year October 2016–September 2017.2 Colombia had the biggest share in these exports, exporting 78.1 tons of quinoa.
European domestic production is also substantial, especially in France, Spain and the Netherlands. We intend to provide figures in a later update.
Figure 4: Share of main origins in European imports by volume, March 2017–February 2018
Import countries
The biggest European buyers are France, Germany, the Netherlands, Spain and Italy. The biggest year-on-year growth was produced in Ireland (392%), Latvia (267%), Iceland (258%), Finland (174%) and Estonia (154%), who are each much smaller importers.
Figure 5: Share of the total EU import by import country, October 2016–September 2017

[1] Based on the exchange rate on 25/05/2018

[2] Source ITC Trademap. September 2017 is the last month for which full global data are available here.