Larger import volume
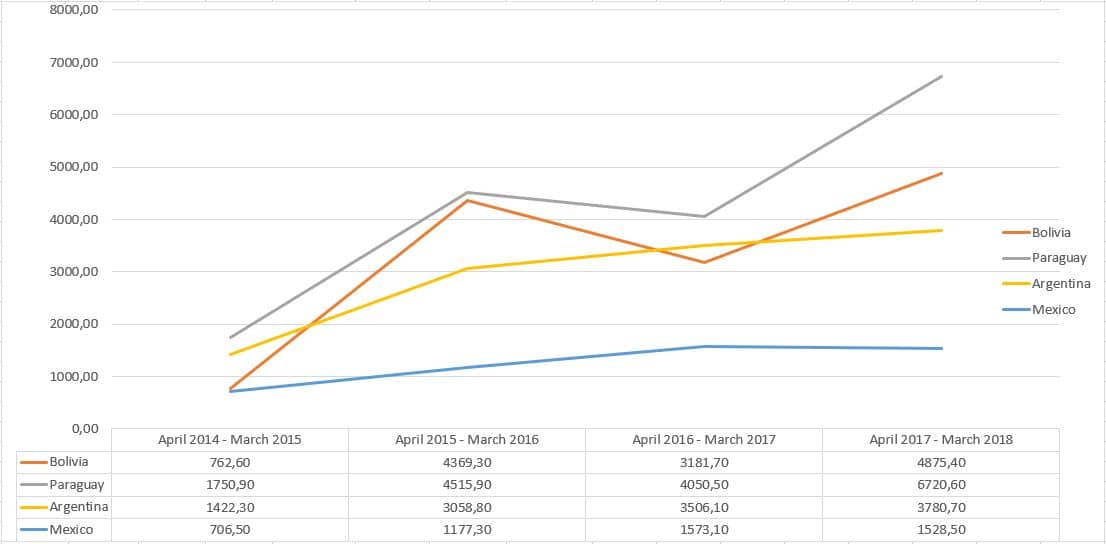
Last year chia imports of the European Union increased by 37%. This is compared to the year before, each year starting in April and ending in March (Figure 1). The four main chia exporting countries, Bolivia, Paraguay, Argentina and Mexico, exported a total of 16905 tons to European Union countries. Paraguay has the biggest share in these exports; it exported 6721 tons of chia to EU countries, an increase of 66% compared to the year before (Figure 2). Bolivia increased greatly as well, by 53%, but with 4875 tons it can’t keep up with Paraguay.1
Figure 1: Chia imports in tons per year, 2014/15 – 2017/18, year ending March
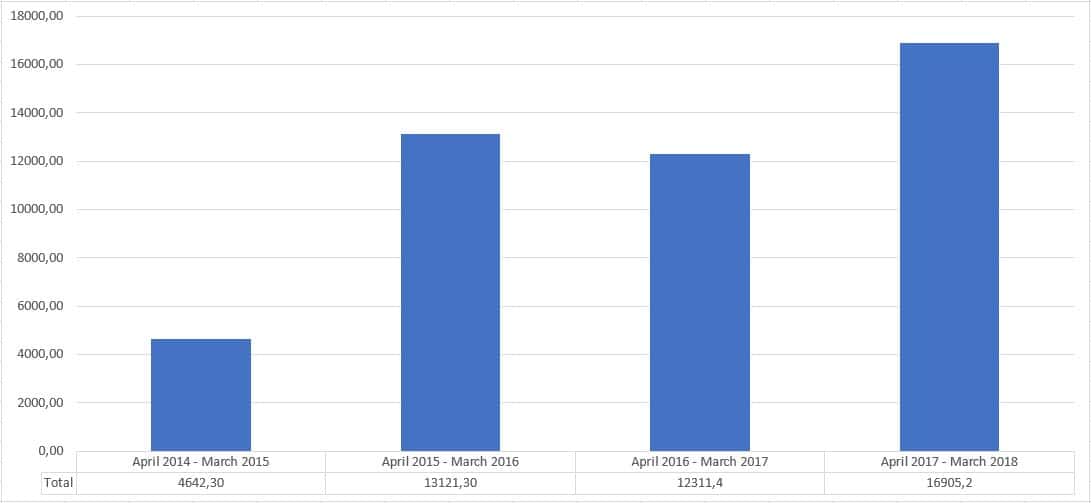
Figure 2: Chia exports to EU countries in tons per year, April 2014 – March 2018
Value of imports
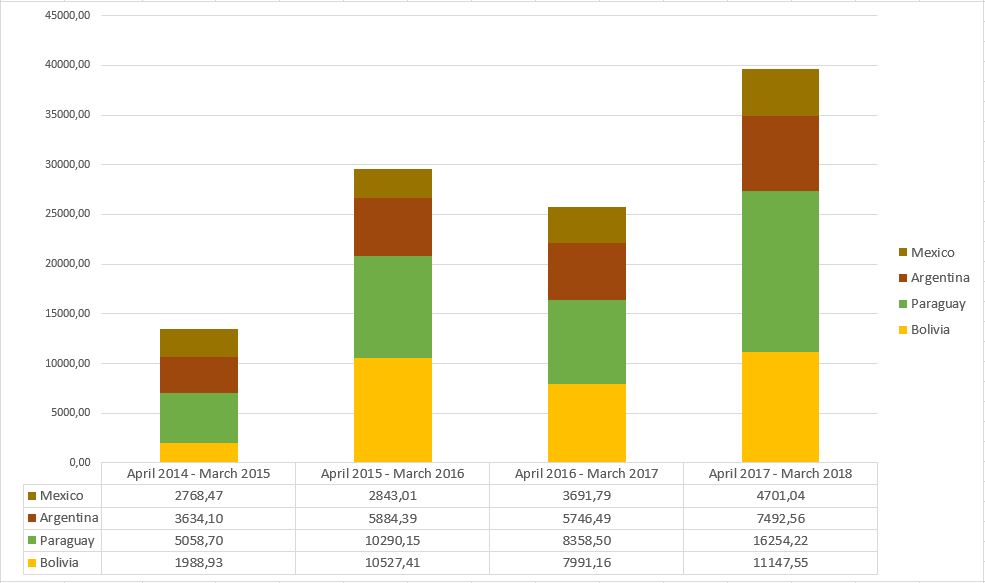
Over the last four years, the value of imports has increased tremendously as well (Figure 3). Although import value decreased 13% in 2016/2017, the overall trend remains firmly upward. A possible explanation for the yearly variations are changes in stock levels. With prices at relatively low levels, it’s possible that importers in Europe are buying relatively too much and are thus building up stock. Whether or not this is the case will become clear in the coming year.
Figure 3: Value of imports per country in euros, 2014/15 – 2017/18, ending March
Price trend
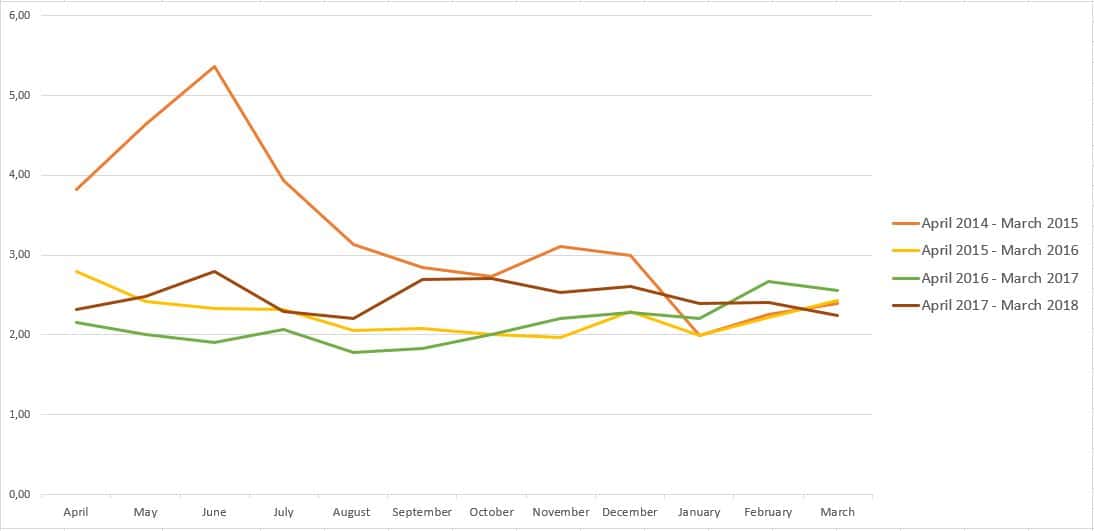
The average chia price was higher than the year before during most of the past 12 months, but in February and March it dropped below this level (Figure 4). Between April 2016 and March 2017, the average import price fluctuated from €2.21 to €2.79 per kg (US$2.56 – US$3.23)2. The average price contains all types of imported chia (black, white, organic, conventional).
Figure 4: Average chia price per month in euros, 2014/15 – 2017/18 ending March
Main origins
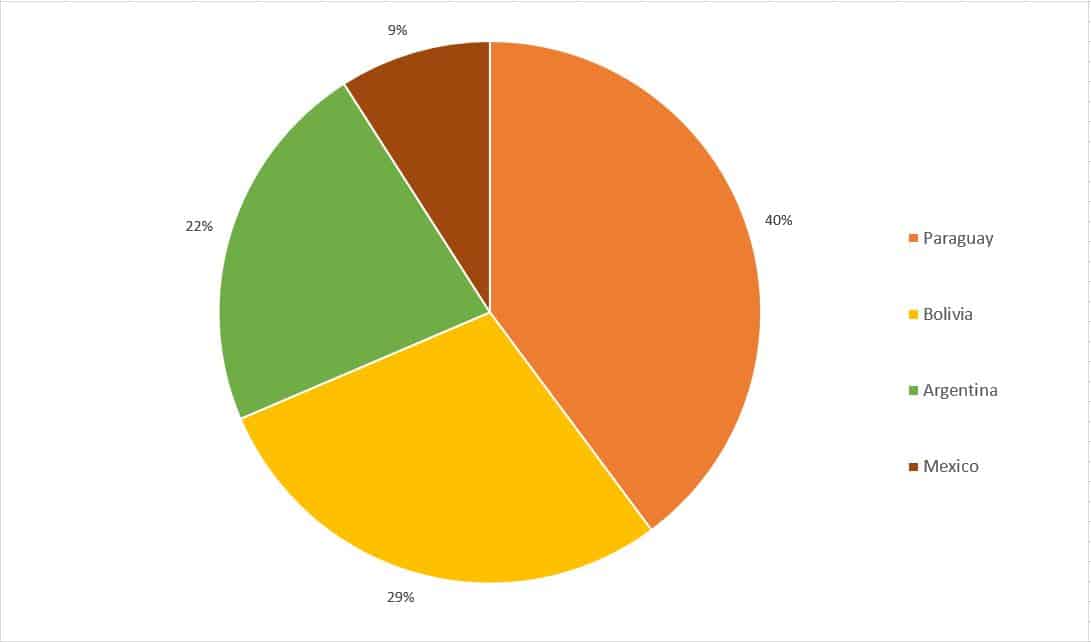
Paraguay has had the biggest share in chia imports of the European Union, with 40% of total (Figure 5). This has been the case for the last four years, although the difference has grown. In the period April 2016–March 2017, Paraguayan exports increased by 67%, Bolivian exports by 53%, and Argentinian exports 8%. Mexican exports decreased by 3% last year.
Figure 5: Share of main origins in European imports by volume, April 2017 – March 2018
Destination of imports
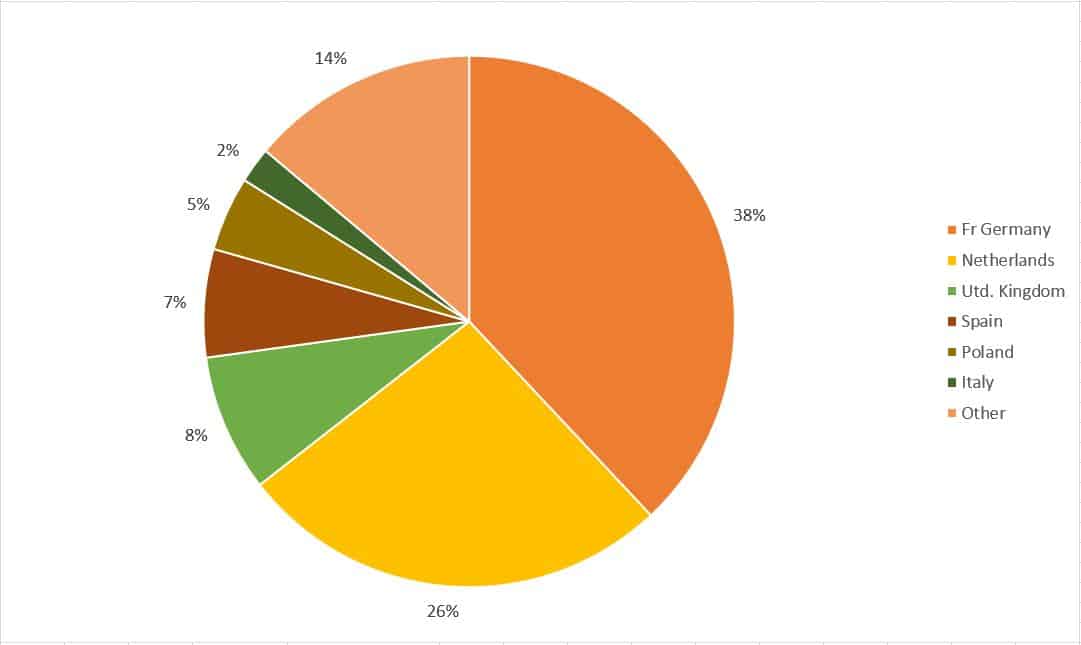
The biggest European Union importers of chia are Germany and the Netherlands. Together they import 64% of total chia imports to the European Union (Figure 6). Because the Dutch import has grown significantly by 58% compared to the previous year, the Dutch share of the total imports within the European Union has grown from 23 to 26%. Imports in other countries have increased as well, Spanish imports by 57%, imports by the United Kingdom by 39% and Italian imports by an amazing 105%. The German imports have decreased by 19%. We may therefore conclude that European chia imports are starting to spread amongst European countries. Interestingly, this trend will be strengthened with the liberalization of the European novel food regime, which took effect in January 20183. This means that it is now easier for importers in the European Union to import chia directly. Germany, however, is still the main importer of chia in the European Union.
Figure 6: Share of the total EU import per import country by volume, April 2017 – March 2018
[1] There is no HS code solely for chia, therefore HS code 120799 is used for this analysis of trade figures;
      chia is the main product within this code for these countries (CBI, 2014).

[2] Based on the exchange rate on 20/6/2018.

[3] The requirements for importers to have a license for novel food imports was lifted as of 1st January 2018.