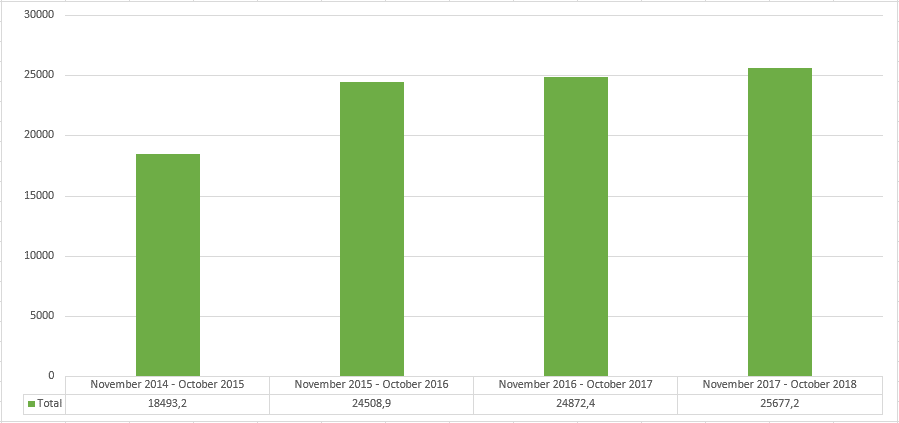
European quinoa imports grew 3% in the year ending October 2018, reaching 25677 tons (Figure 1). In the previous year, imports only grew 1%. Peru and Bolivia still dominate European Union quinoa imports, while Ecuador and, recently, Turkey also hold small market shares. These statistics don’t include Europe’s domestic production of several thousand tons.
Figure 1: Quinoa import in tons per year, 2014/15-2017/18 ending October
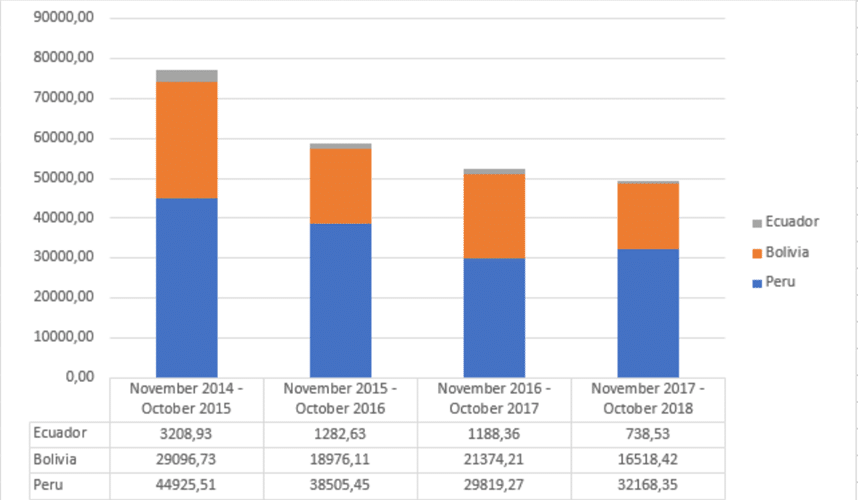
Import value drops
Import values continued to drop. For the year ending October 2018 the drop in value was 5.5% (Figure 2). The cause is a lower average price. The loss in value, however, is smaller than in the previous year.
Figure 2: Import value per year, in €1000, 2014/15-2017/18 ending October
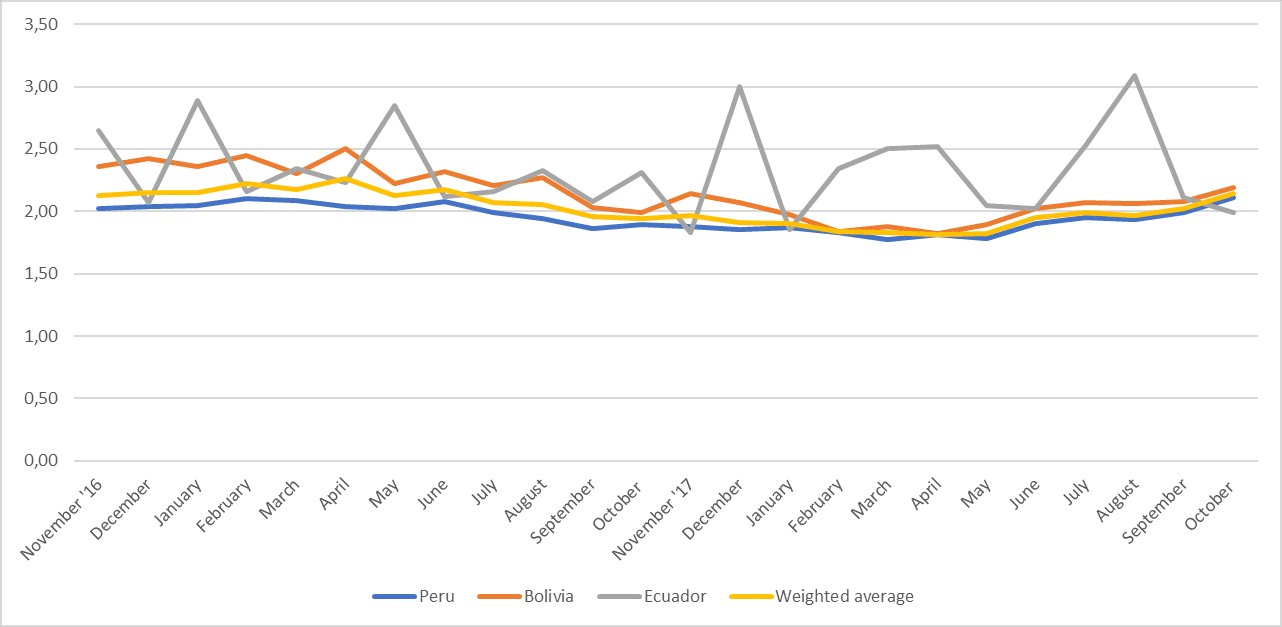
Price trend is reversed upward
In June 2018, the average import price started to increase again (Figure 3). The price of October 2018 (€2.14 per kg) was the highest since June 2017 (€2.18 per kg). Thus, a downward cycle that started as early as 2014 has come to an end, at least temporarily. In October 2014 the average import price was €4.95 per kg.
Trade sources give two main reasons why the price increases: a smaller than expected harvest in Peru and Chinese buying activity. The visit of Chinese President Xi Jinping to Bolivia has raised expectations about Chinese quinoa buying. China liberalised its market for Bolivian quinoa per January 2019 and Chinese importers have indeed started buying in both Bolivia and Peru. The price of Peruvian organic white quinoa has been nearly 3 US$ per kg since October 2018, so statistics will continue to show an upward price trend in the coming months.
Figure 3: Monthly quinoa price in € per kg, November 2016 – October 2018
Origin of imports
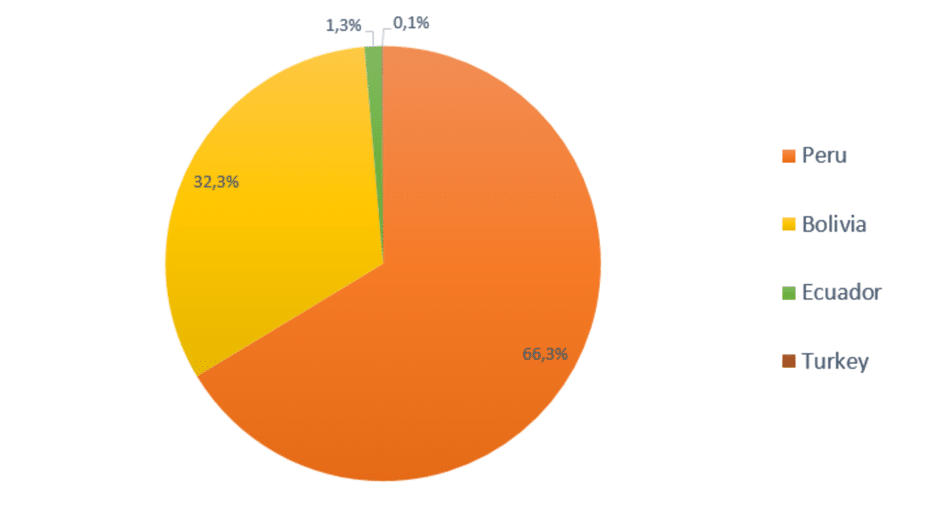
The main exporters of quinoa to countries of the European Union are Peru and Bolivia. Peru still holds the main share of exports with 66% of import volume and Bolivia has 32% (Figure 4). The Bolivian quinoa is generally more expensive than the Peruvian, so their value share is higher. Ecuador has a much smaller share of 1.3%, while Turkey has gained a presence in the import statistics with 0.1% share. With production of several hundred tons of quinoa in 2018, Turkey is actively seeking to increase this share.
Figure 4: Share of main origins in European imports by volume, November 2017 – October 2018
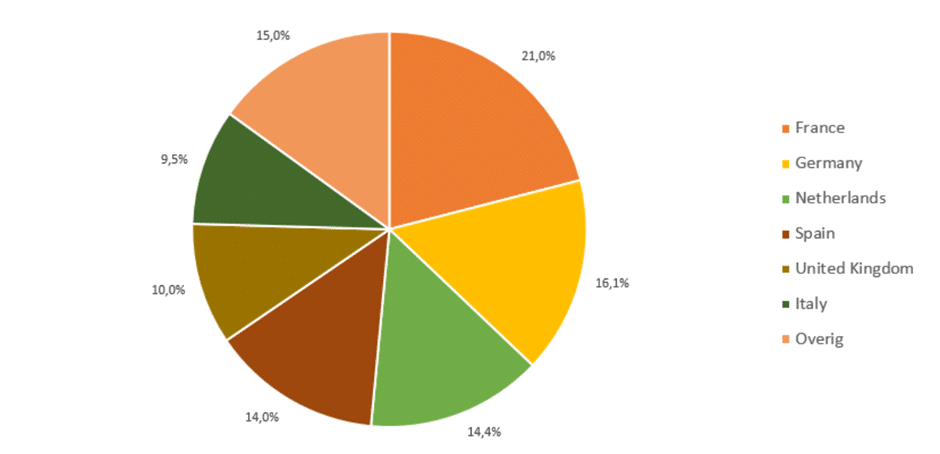
Destination of imports
France is the biggest European Union importer of quinoa, closely followed by Germany, the Netherlands and Spain (Figure 5). The six biggest European Union importers of quinoa each hold a fair share, so there is less concentration in the import market than in the export market. In the period under review, the Dutch imports increased by 36%, the fastest growth of the main importers. German imports remained stable, while France and the United Kingdom witnessed a decrease in quinoa imports of 12%.
Figure 5: Share of total EU import per country by volume, April 2017 – March 2018